
Transforming data into insights, insights into action
Unlock the power of your data with our comprehensive data management, BI, and visualization solutions
Why Choose Us
Data Management
To ensure that data is properly collected, processed, and stored, ensure that data is properly stored and analysed.
Business Intelligence (BI)
To gain a better understanding of their data and make informed decisions based on that data, organisations should use it.
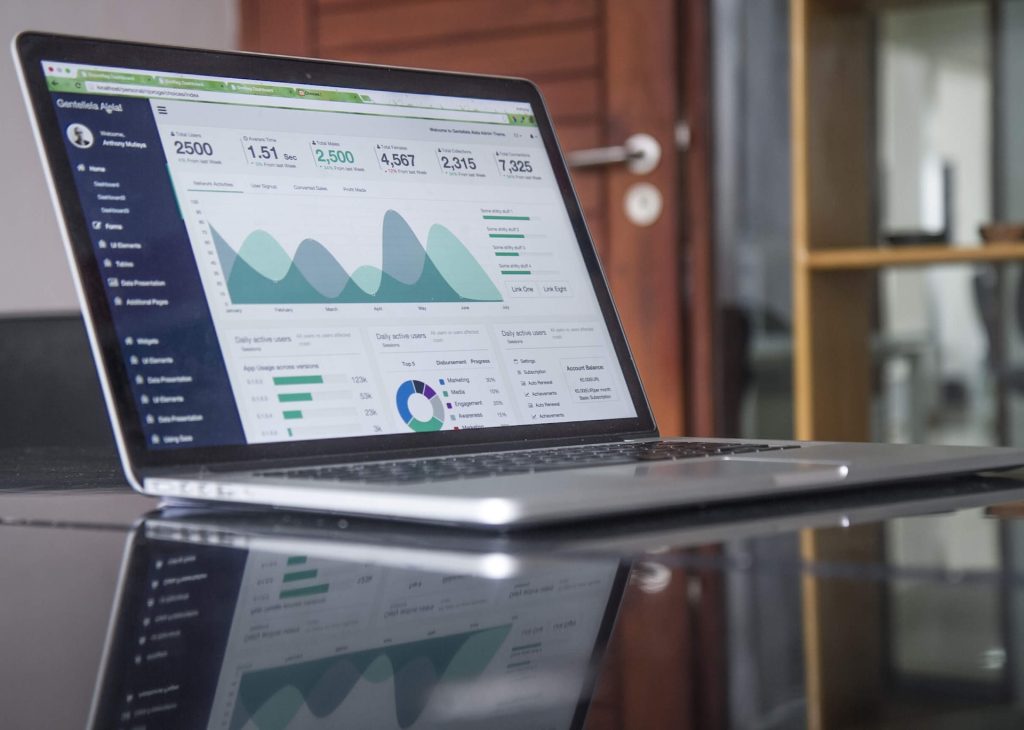
Data Visualization
By showing data in a visually appealing and easy-to-understand manner, business can gain a better understanding of it.
About our company
At The Green Techno, we are passionate about helping enterprises collect, analyse, and interpret data in a way that can be used to make decisions and drive business growth. Our data management, business intelligence, and data visualization services are designed to help organisations collect, analyse, and interpret data in a way that maximizes its value. Working with our clients provides us with a thorough understanding of the latest tools and techniques in the field of data management, business intelligence, and data visualization.
Our Services

Data Management
Data management refers to the creation of a framework that enables firms to handle their data properly. Data management involves data modelling, data integration, data quality control, data security, and data governance. Data management services include data collection tools and technologies, as well as data processing and storage solutions. Data quality control, data security, and data governance are some of the things that data management services involve.
Business Intelligence (BI)
To obtain insights into business performance and management, businesses must investigate data. Data analysis consists of extracting, transforming, and loading data, and then analysing it in order to gain insights. Business intelligence services help organisations make better business decisions by helping them gain a better understanding of their data. Analytics, data mining, data visualization, and reporting tools are used to turn data into actionable insights that can be used to drive business growth and success.

Data Visualization
A chart, graph, or other visual format is used to display data in a meaningful or useful way. It is important to use visual aids, such as charts, graphs, and other visual formats, in data visualization to help businesses understand their information more easily. The process of showing data in a meaningful or useful way includes using visual aids, such as charts, graphs, and other visual formats, to help businesses understand their information more easily.
Our Happy Clients!
Get In Touch With Us
Don't Wait Contact Us Now